CU Monitoring Report reads straight from the underlying HANA database of your tenant, calculates consumption by space and object, and tracks it against your contracted cap, it shows up on a dashboard when it reaches the threshold, so there are no surprises.
From the live dashboard on our own Datasphere tenant. KPI and per-space figures are exact, the timeline is an illustration of the consumption pattern.
Capacity Units are billed at the tenant level, but consumption is driven space by space, object by object. Without a breakdown, the first sign of trouble is often a throttled task, or a call from your account executive about ordering more capacity.
Consumption is only visible in the Capacities Monitoring app, one CSV export at a time. No per-object trend, no forecast, and no alert until you're already close to the limit.
The underlying HANA database is read directly and calculated daily, so you see which space is driving growth and how many weeks of runway are left.
Built on your own data: consumption and your tenant's contracted CU cap are joined automatically, so headroom is always a live calculation.
Every figure comes from your own tenant's underlying HANA database, refreshed on a schedule you control. Nothing here is estimated after the fact.
Reads the underlying HANA database on a schedule, alongside your tenant's contracted CU cap. No CSV exports, no manual copy-paste.
Calculates consumption by space, object and day, and compares it against the contracted cap to compute headroom and trend.
Pushes the result to the dashboard and flags any space crossing its threshold before a task gets throttled.
A month of consumed capacity units and blocks on our own Datasphere tenant, exactly as CU Monitoring Report shows it. Only the crop is ours.
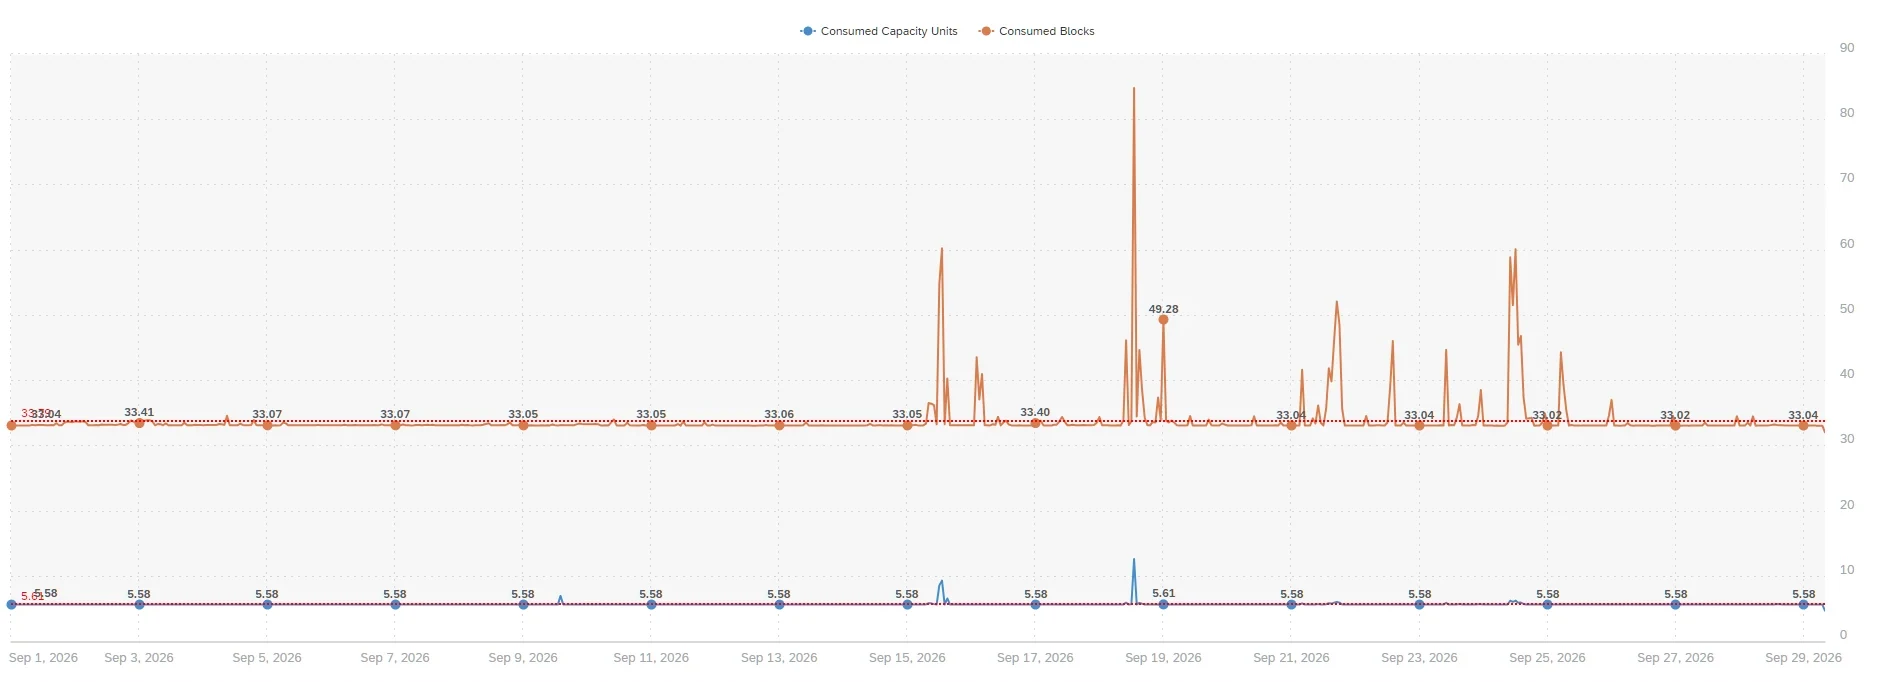
Consumed capacity units and blocks per day, September 2026.
A 30-minute walkthrough on our own Datasphere tenant where we'll show the dashboard end to end and talk through what it takes to point it at yours.